

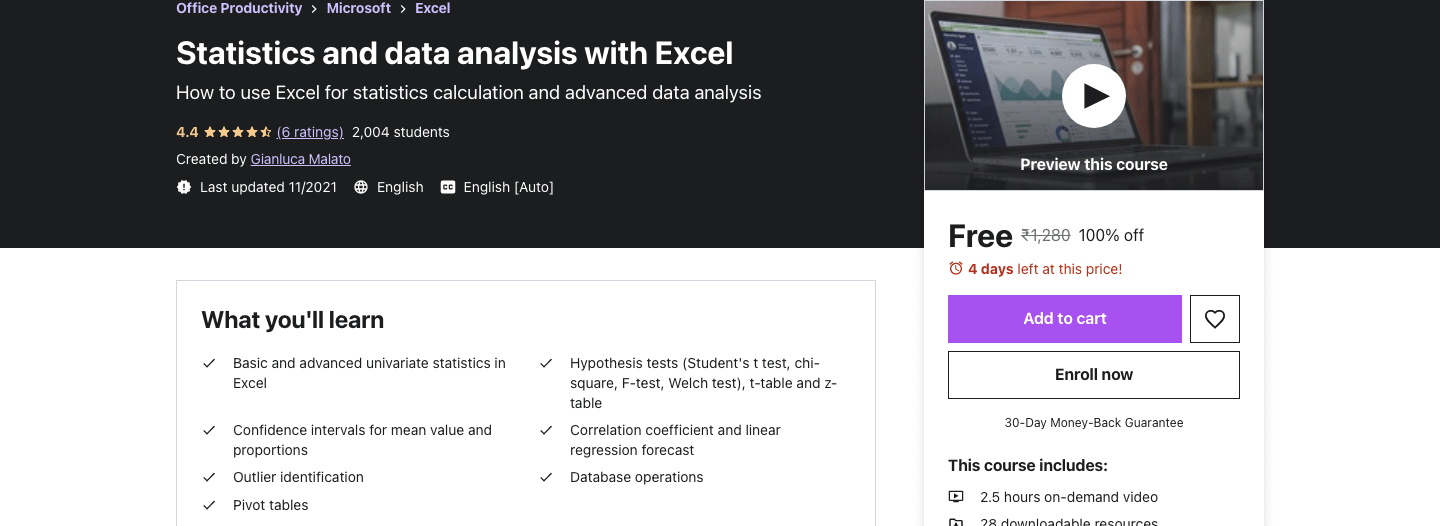
Free Certification Course Title: Statistics and data analysis with Excel
How to use Excel for statistics calculation and advanced data analysis
Free Certification Course Title: Statistics and data analysis with Excel
How to use Excel for statistics calculation and advanced data analysis
In this practical course, we are going to focus on how to perform advanced statistical calculations and data analysis using Microsoft Excel.
Excel is a very used tool in several companies and has very powerful data analysis capabilities that can be used by data analysts and marketing experts. Even if you work with a lot of statistics you’d be surprised at how valuable Excel is for calculating hypothesis tests and the most common metrics you can calculate on a dataset. There are several basic and advanced functions you can use to get the best from your data and that’s why Excel is a very useful tool for anybody who needs to crunch data and perform analyses of various kinds.
This course can be attended by both data analysts and marketing experts who need to work with data and surveys.
With this course, you are going to learn:
How to Subscribe for Statistics and data analysis with Excel?
Apply Coupon Code: D08E132CEA739E8EBB98
Facebook Group(Mandatory to Join): Click Here
Join our Telegram group(Free Certification Courses – 43K Members): Click Here
Join our Telegram group(67,000+ Members: Daily Jobs): Click Here
WhatsApp Group(Only for Indian Users): Click Here to Join
Table of Contents


