

Free Certification Course Title: Interactive Microsoft Excel Dashboard for Data Analyst 2022
How to build Interactive Excel Dashboards that Update with ONE CLICK! Creative and outstanding design Excel Dashboard
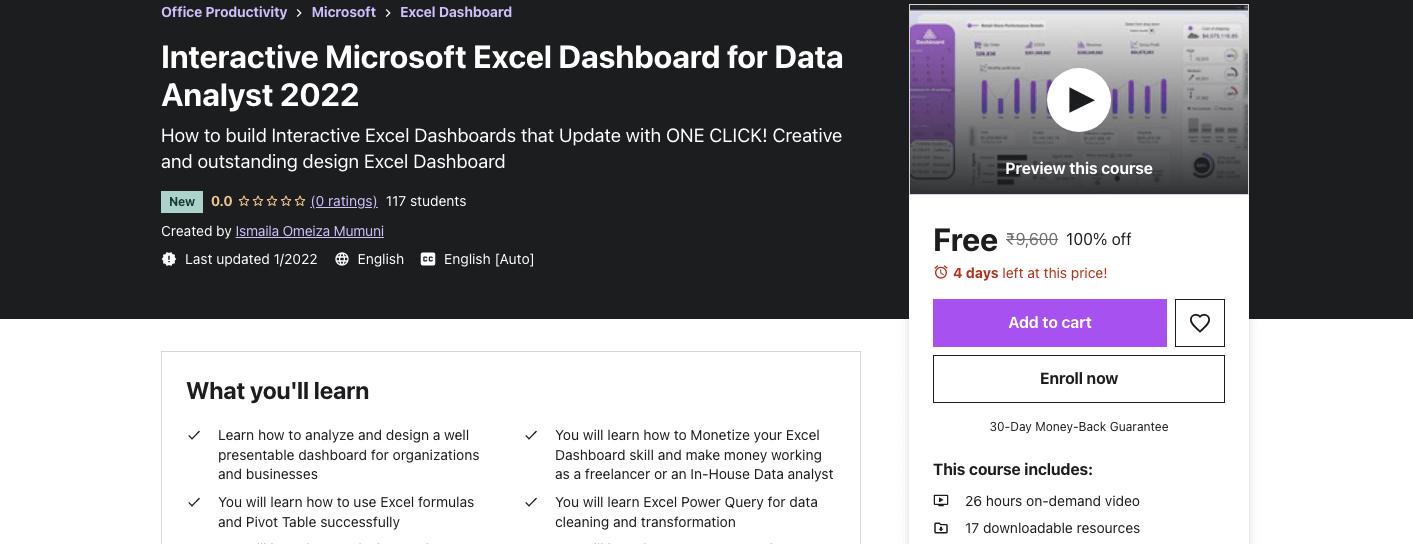
What you’ll learn:
-
Learn how to analyze and design a well presentable dashboard for organizations and businesses
-
You will learn how to Monetize your Excel Dashboard skill and make money working as a freelancer or an In-House Data analyst
-
You will learn how to use Excel formulas and Pivot Table successfully
-
You will learn Excel Power Query for data cleaning and transformation
-
You will learn how to design modern dashboards
-
You will learn how to use Power Pivot to manage huge rows of data without breaking down
-
You will learn how to use DAX measures to speed up analysis and create dashboards
-
How to create your portfolio (Online presence)
-
How to receive payment from clients
-
How to approach clients project
-
Will learn how to pitch for jobs
Requirements:
-
No pervious programming or Excel knowledge is needed. We got you cover from the scratch to the advance level of the course.
-
Just Microsoft Excel
-
Excel 2016, Excel 2019 or Excel 365
-
Analytics thinking mind-set
Who this course is for:
- This course is for those that are trying to grab a career in Data
- If you want to become a successful Data Analyst Freelancer or an In-House Data Analyst this course is for you
- If you want to a create colorful and never seen Excel Dashboard designs before, this course is for you
- Need to stand-out in your office or organization like I am? This course is for you
Description:
This course will take you beyond your expectations, I have put together all you need to master data analytics and dashboard creation. We use real-life datasets that are companies and industry standards.
You will learn from my years of experience as an analyst, data analytics freelancer, and as well learn how to monetize your data analytics skills and make money from them.
We have more projects in this course than you can ever find from other instructors (courses) on this platform. We illustrated all projects using a real-life dataset that applied to day-to-day business activities.
All the dashboards taught in these classes are not only dynamic and interactive but all so have outstanding designs.
By participating in this Microsoft Excel Dashboard course you’ll gain the widely sought-after skills necessary to effectively analyze large sets of data.
You will learn Power Query for data cleaning and transformations, Power Pivot to handle huge datasets like millions of rows of data and have it analyzed in Excel.
You learn how to manipulate data with DAX language in Power Pivot and as well create easy relationships between multiple tables instead of using basic lookups that might slow your analytics down.
This course includes:
-
26 hours on-demand video
-
17 downloadable resources
-
Full lifetime access
-
Access on mobile and TV
-
Certificate of completion
How to Subscribe for Interactive Microsoft Excel Dashboard for Data Analyst 2022?
- Sign Up on Udemy.com
- Subscribe Here(Interactive Microsoft Excel Dashboard for Data Analyst 2022): Click Here
Apply Coupon Code: ECBEF61BEA8209B977D4
Facebook Group(Mandatory to Join): Click Here
Join our Telegram group(Free Certification Courses – 43K Members): Click Here
Join our Telegram group(67,000+ Members: Daily Jobs): Click Here
WhatsApp Group(Only for Indian Users): Click Here to Join
Table of Contents


