

Free Certification Course Title: Data Visualization using Matplotlib & Plotly(Python Library)
Design and Create attractive Data Visualization for Decision making using Popular Python Library Matplotlib and Plotly
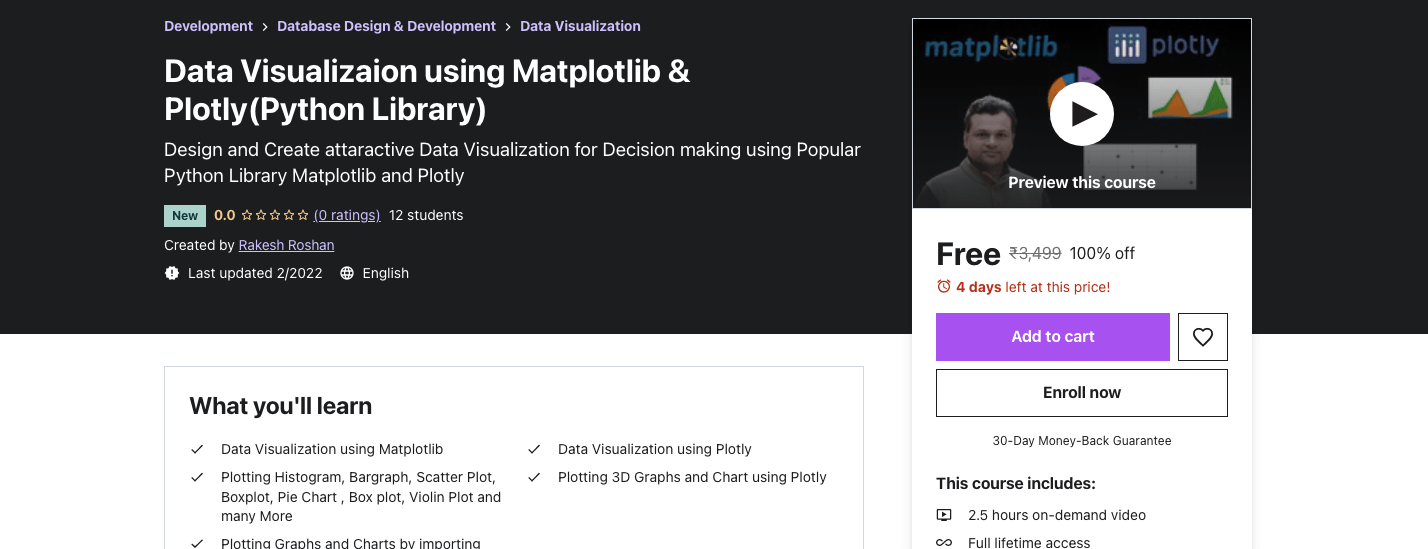
What you’ll learn:
-
Data Visualization using Matplotlib
-
Data Visualization using Plotly
-
Plotting Histogram, Bargraph, Scatter Plot, Boxplot, Pie Chart , Box plot, Violin Plot and many More
-
Plotting 3D Graphs and Chart using Plotly
-
Plotting Graphs and Charts by importing data
Requirements:
-
Basic Knowledge of Python
Who this course is for:
- Students, Teachers, professionals who want to use Data Visualization tools for taking decisions
- Students, Teachers, professionals who want to go for Data Science, Machine Learning, Data Analysis, and Data Visualization
Description:
Currently, Data Visualizations is a very important tool that deals with the graphical representation of the data. It is a very effective way of communication in decision making, advertisement, data analysis, Machine Learning and Data Science. And some of the python libraries like matplotlib and plotly are very popular for data visualization. Also, it is very important to get the knowledge that, what kind of graphs or charts we use to represent the data. After completing this course, you can able to design different types of graphs and charts very easily.
Important Feature of this course is as follows:
- Here we cover 2D as well as 3D Graphs and Charts.
- This course can be done by Business and Managements people also
- Every topic is covered practically.
- Explained in very easy language.
- Non-Programming background can also understand easily.
- Each Graph and Chart is demonstrated in a simple way so that you can do the same by watching videos.
This course includes:
-
2.5 hours on-demand video
-
Full lifetime access
-
Access on mobile and TV
-
Certificate of completion
How to Subscribe for Data Visualization using Matplotlib & Plotly(Python Library)?
- Sign Up on Udemy.com
- Subscribe Here(Data Visualization using Matplotlib & Plotly(Python Library)): Click Here
Apply Coupon Code: 41648AB5E89A77B07B3E
Facebook Group(Mandatory to Join): Click Here
Join our Telegram group(Free Certification Courses – 43K Members): Click Here
Join our Telegram group(67,000+ Members: Daily Jobs): Click Here
WhatsApp Group(Only for Indian Users): Click Here to Join
Table of Contents


