

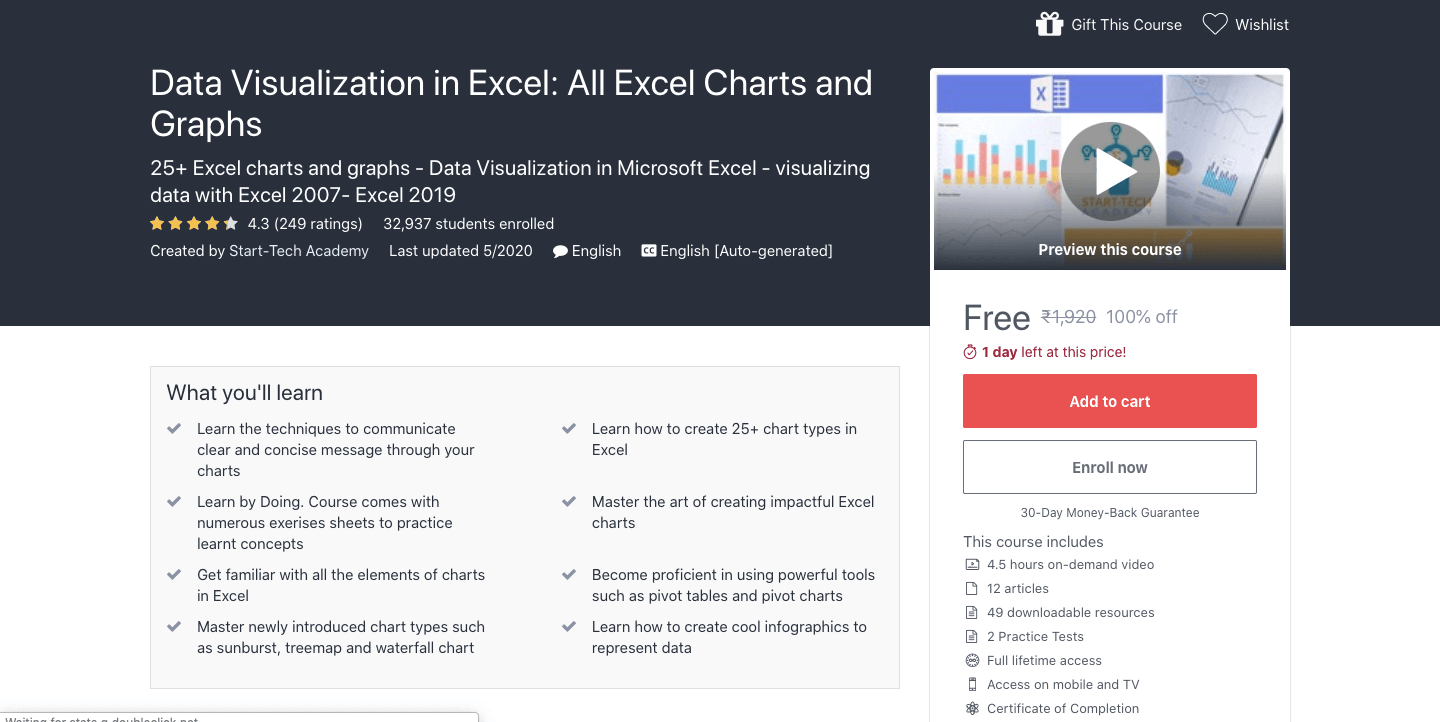
Free Certification Course Title: Data Visualization in Excel: All Excel Charts and Graphs
25+ Excel charts and graphs – Data Visualization in Microsoft Excel – visualizing data with Excel 2007- Excel 2019.
Requirements:
- You will need a PC with any version of Excel installed in it.
- Basic understanding of Excel operations like opening, closing and saving a file.
What you’ll learn:
- Learn the techniques to communicate a clear and concise message through your charts.
- Learn how to create 25+ chart types in Excel.
- The course comes with numerous exercises sheets to practice learnt concepts.
- Master the art of creating impactful Excel charts.
- Get familiar with all the elements of charts in Excel.
- Become proficient in using powerful tools such as pivot tables and pivot charts.
- Master newly introduced chart types such as sunburst, treemap and waterfall chart.
- Learn how to create cool infographics to represent data.
Who this course is for:
- Anyone curious to master charts in excel from beginner to advanced in a short span of time.
This course includes:
- 4.5 hours of on-demand video.
- 12 articles.
- 49 downloadable resources.
- 2 Practice Tests.
- Full lifetime access.
- Access on mobile and TV.
- Certificate of Completion.
Created by Start-Tech Academy
How to Subscribe for Data Visualization in Excel: All Excel Charts and Graphs?
- Sign Up on Udemy.com
- Subscribe Here(Data Visualization in Excel: All Excel Charts and Graphs): Click Here
Apply Coupon Code: UXFTEMA
**Note: Free coupon/offer may expire soon.**
Table of Contents


