

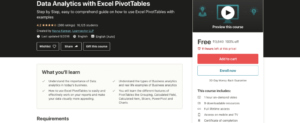
Free Certification Course Title: Data Analytics with Excel PivotTables
Step by Step, easy to comprehend guide on how to use Excel PivotTables with examples
Requirements:
-
All you need is a Microsoft Excel installed on your desktop.
-
With a basic know-how of Excel you are good to go ahead with this course
What you’ll learn:
-
Understand the importance of Data analytics in today’s business.
-
Understand the types of Business analytics and real life examples of Business analytics
-
How to use Excel PivotTables to easily and effectively work on your reports and make your data visually more appealing.
-
You will learn the different features of PivotTables like Grouping, Calculated Field, Calculated Item, Slicers, PowerPivot and Charts
Who this course is for:
- This course is helpful for anyone who works on Excel reports as this will make reporting more efficient.
- If you deal with business presentations, then you can make use of this powerful tool to make an impact
This course includes:
-
1 hour on-demand video
-
9 downloadable resources
-
Full lifetime access
-
Access on mobile and TV
-
Certificate of completion
How to Subscribe for Data Analytics with Excel PivotTables?
- Sign Up or Sign in on Udemy.com
- Subscribe Here(Data Analytics with Excel PivotTables): Click Here
Apply Coupon Code: A8CBC7F28DCB706216F5
**Note: Free coupon/offer may expire soon.**
Table of Contents


